Ongoing & Completed Projects
AI Readiness Assessment and Tailored Training Module Design for Administrative Officers of the Government of Bangladesh
A recent study by the Data and Design Lab at the University of Dhaka, funded by the BIAM Foundation Research Center, examines the preparedness of Bangladeshi administrative officers for the age of artificial intelligence (AI). As AI becomes increasingly important for modernizing public service delivery and keeping pace with global developments, administrative officers—the primary implementers of government policies—must be equipped to use these technologies effectively. However, generic AI training does not address the domain-specific needs of Bangladeshi administrative officers, and the country currently lacks comprehensive AI policies, operational guidelines, and structured training frameworks.
The study assessed officers’ AI readiness, identified barriers to AI adoption, and developed an evidence-based, tailored AI training module. Using a mixed-methods approach that combined surveys, in-depth interviews, group discussions, and field observations, the research found that officers possess moderate AI literacy and are at a developing stage of AI readiness. The principal barrier to adoption is not a lack of interest but the absence of policy direction, accountability mechanisms, and data security protocols. Although many officers are already using AI informally, the lack of official guidance exposes public institutions to risks, particularly concerning data privacy.
These findings underscore the urgent need for a national AI governance framework that defines acceptable use, accountability, and data protection standards. Differences in infrastructure readiness between senior officials and field-level officers also point to the need for targeted investments in digital infrastructure and practical capacity-building initiatives. To address these gaps, the study developed and validated a Tailored AI Training Module that reflects the realities of Bangladeshi administrative work by integrating practical AI skills with governance, ethics, and accountability. Together, the proposed governance framework and tailored training provide a roadmap for the responsible adoption of AI in the public sector, helping Bangladesh reduce risks, strengthen institutional capacity, and advance toward a more efficient, responsive, and data-driven public administration.
The Impact of Artificial Intelligence (AI) on Higher Education Teaching-Learning Practices in Bangladesh
This research explores the integration of Artificial Intelligence (AI) in teaching and learning within higher education institutions in Bangladesh. Despite global interest in AI-enhanced education, its adoption in Bangladesh remains limited and underexplored. While some institutions have implemented AI solutions, their effectiveness and impact on student engagement, learning outcomes, and teacher workload are not well-documented.
The study investigates the potential benefits of AI, including personalized learning, improved student engagement, and streamlined administrative processes. However, challenges such as outdated teaching methods, low digital literacy among educators, and institutional resistance hinder AI adoption. The research aims to assess how AI can address these challenges and enhance educational quality.

The primary objectives of the study include assessing the current state of AI implementation, identifying its benefits, exploring obstacles faced by educators and students, and evaluating the readiness of faculty and students to adopt AI tools. Using a mixed-methods approach, data will be collected through surveys of 400 students, interviews with 12 faculty members, and focus groups with 4 educational administrators from 4 universities in urban and semi-urban areas.
This study intends to provide insights into how AI can enhance higher education in developing countries like Bangladesh, offering recommendations for policymakers and educators on effectively integrating AI into teaching and learning.
Examining the After-School Educational Experiences of Secondary Students in Bangladesh
This research investigates the after-school teaching-learning activities of secondary school students in Bangladesh, exploring how these activities contribute to their academic development and overall well-being. While after-school programs have become increasingly popular worldwide, their impact on students in Bangladesh remains under-researched. This study aims to fill this gap by examining the types of after-school activities students engage in, the frequency of their participation, and the perceived benefits and challenges of these activities.
The research focuses on understanding how after-school tutoring, extracurricular activities, and self-study contribute to student learning outcomes, motivation, and social development. It also investigates the role of parents, teachers, and community members in supporting these activities and how socio-economic factors influence students’ access to after-school opportunities.
The primary objectives of the study are to assess the variety of after-school activities available to secondary students, analyze how these activities impact their academic performance, and identify barriers that limit participation, particularly for students from disadvantaged backgrounds. The research employs a mixed-methods approach, combining quantitative surveys with qualitative interviews and focus groups. Data will be gathered from a sample of students, teachers, and parents across selected secondary schools in urban and rural areas of Bangladesh.
By exploring the after-school experiences of secondary school students, this study intends to provide insights into how such activities can be optimized to enhance student outcomes. The findings will help inform policy recommendations for improving after-school programs, ensuring they are inclusive, effective, and accessible to all students, regardless of their socio-economic background.
AI Bias in Instructional Practices: Context of Developing Countries
This research investigates AI bias in instructional practices within developing countries. As AI is increasingly integrated into education, its potential to enhance learning is clear. However, biases in AI systems—especially in algorithms—raise concerns, particularly in regions with limited resources and digital literacy. The study focuses on how AI tools, like adaptive learning platforms and automated grading systems, may unintentionally reinforce biases related to culture, language, socio-economic status, or gender, leading to unequal educational opportunities.
The research will assess the nature of AI bias in educational settings and its impact on marginalized groups. It also explores the challenges educators face in addressing these biases and the strategies used to ensure fairness and inclusivity. A mixed-methods approach will be used, combining quantitative surveys on AI usage with qualitative interviews and focus group discussions involving educators, policymakers, and students.
The study intends to provide insights to guide the development of more equitable and effective AI solutions for education in developing countries.
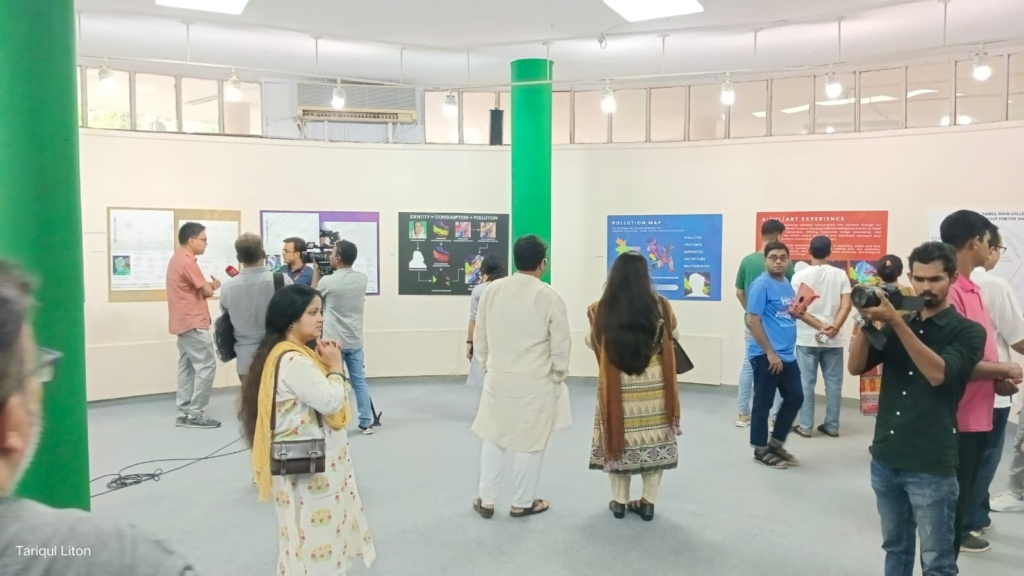
AI ART Exhibition 2024
Welcome to our Interactive AI Art Show “Identity = Consumption + Pollution”
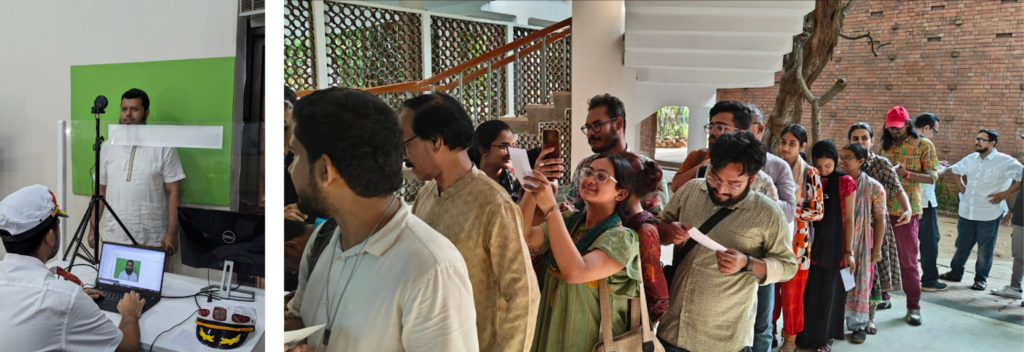
We are delighted to welcome you to this unique exhibition, where art, artificial intelligence, and environmental consciousness converge. By now, we hope you’ve collected your AI-generated passport from our immigration booth, and we thank you for your patience in obtaining your very own AI/ML/Data passport.
The Concept
Our theme merges climate change and immigration, highlighting the paradox of seeking better lives while our consumption habits pollute the natural world. This exhibition introduces a new form of identification—a passport that links your consumption habits to environmental impact. The electricity we consume, the water we use, and the fuel we burn all contribute to pollution, which in turn affects the air we breathe and the water we drink. Often, these impacts are quantified as vast amounts of data that may seem abstract. But what if those numbers had colors? What if they could be integrated into our identities?
The Artworks
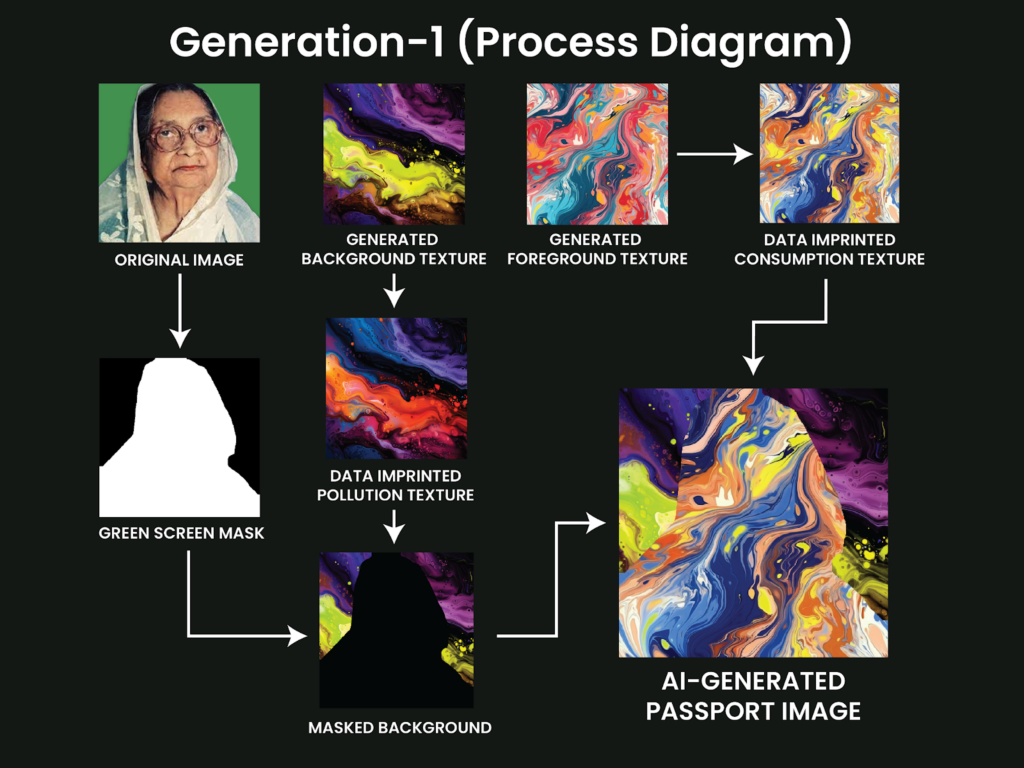
The artworks on display are AI-generated data passports that illustrate the relationship between consumption and pollution. Each piece starts with a photo of an individual, which is then transformed into an artistic representation of their environmental impact. The foreground of the portrait reflects the individual’s consumption data, while the background visualizes the pollution resulting from that consumption. This combination provides a holistic view of one’s environmental footprint, turning abstract data into a tangible and visually engaging experience.

The Interactive Experience
At the immigration booth, a person’s profile picture is taken and transformed using data from various regions in Bangladesh. We use one year of data encompassing three types of pollution and three types of consumption, combined with the poverty index of each region. These datasets are visualized through AI-generated textures that represent pollution and consumption, which are then applied to the photograph.
Color Channels and Data Representation:
- Red Channel: Electricity Consumption, Noise Pollution
- Green Channel: Fuel Consumption, Air Pollution
- Blue Channel: Water Consumption, Water Pollution
Creation Process
The AI-generated passport images are created through the following steps:
- Image Capture: A photo is taken with a green screen background.
- Masking: The green screen is removed from the image.
- Foreground Transformation: The person’s image is overlaid with an AI-generated texture that incorporates consumption data.
- Background Transformation: The green screen is replaced with an AI-generated texture embedded with pollution data.
Exhibition Highlights
- Interactive AI Immigration Booth: Visitors receive a passport that combines their photo with AI-generated textures based on consumption and pollution data.
- Data-Driven Artworks: The exhibition features images divided into two parts: an upper part showcasing a reimagined landmark from the person’s chosen region, and a lower part displaying the data-enhanced portrait.
- Encrypted Identity: Each passport includes a unique identifier combining the person’s name and region, symbolizing the link between personal identity and environmental impact.
Exhibition Background
This project underscores the intricate relationship between human consumption and environmental pollution. Our consumption of electricity, water, fuel, and other resources drives environmental degradation, which in turn impacts ecosystems and human health. Recognizing this, our exhibition uses art and AI to highlight these connections, promoting environmental awareness and sustainable practices.
Exhibition Concept
In collaboration with esteemed artist, Azyz Sharafy, this exhibition offers an immersive experience that transforms data into vibrant, thought-provoking AI art. Visitors are encouraged to reflect on their environmental impact and consider the broader implications of their consumption behaviors. Through this visual symphony, we aim to inspire a collective commitment to sustainability and environmental stewardship.
Data and Workflow
Our project involves gathering extensive datasets on human consumption and environmental pollution, which are then visualized using advanced AI techniques. The data is divided into two main categories—human consumption and pollution—and integrated into the artworks to create a comprehensive representation of the relationship between individual behavior and environmental impact.
Output
The result is a series of AI-generated passports that encapsulate individual identity and environmental awareness. These artworks serve as powerful reminders of the complex interplay between our actions and the natural world, encouraging contemplation and dialogue about how we can work towards a more sustainable future.
Conclusion
This exhibition explores the intersection of AI, art, and environmental data, aiming to provoke thought and discussion about our consumption habits and their impact on the planet. By transforming data into art, we hope to make the invisible visible and encourage a deeper understanding of our roles in shaping the environment.
Electricity and Consumption
Improving Quality of Power Supply to the Industrial Clusters around Dhaka City

Quality of power supply has three main aspects – Reliability, Power quality, and Commercial quality. The first two are related to the technical aspects of a power system and the last one is related to the quality of service provided to the customers. For Bangladesh, one of the fastest growing economy of the world, the supply of quality electricity is vitally important to meet the growing demand for electricity and to improve the country’s economic condition further. The recent growth of power generation in Bangladesh indicates that the government has successfully met the challenge of expanding the generation capacity. However, significant challenges persist. Rigorous investigation is essential to analyze the existing power supply quality. We also need to evaluate the economic cost of low power quality and how it varies across different industries to take appropriate policies. To overcome these challenges, a complete data base development and a data scientific analysis approach is necessary.
Identifying this knowledge gap, this research proposes a pilot project that aims to incorporate a data driven approach to improve the Quality of Supply (QoS) of our National Power Grid System. To achieve the goal, the study defines a set of Objective Parameters (OP) to monitor the Quality of Supply (QoS) from Big Data Analysis and Sample Survey. Initially, two commercial hubs have been selected for the pilot project, which have a high concentration of commercial industries. Load, complaint, and supply interruption data of two years from two substations and interruption data from four (depending on the availability) industrial customers will be collected and digitized. Power quality data (voltage, frequency data) will be collected by random sampling method through manual inspection from the substations. Following the data preparation, a preliminary analysis will be conducted. Industries will be categorized into different cluster based on OPs. Finally, the study will draw some policy suggestions based on the cluster analysis.
Funded by BEPRC (Bangladesh Energy and power Research Council)
Analyzing current prepaid and past postpaid consumption data of Dhaka south’s electricity users
- Measuring the change in payment and consumption behavior due to the replacing of conventional postpaid meters to prepaid meters.
- Analyzing the consumption data of households before and after prepaid meter intervention and comparing them with households who are still using old meters.
- We found prepaid meters effectively reduced payment delinquency. Further analysis on consumption is still under progress.
Publication:
S. B. Rabbani, A. A. Ali and M. Zaber, “Does Electric Prepaid Meters Decrease Payment Delinquency? Evidence from Data Centric Analysis of Electricity Consumption in Dhaka, Bangladesh” in IEEE Region 10 Symposium (TENSYMP), Dhaka, 2020
Abstract— Prepaid electricity meters are favored by power distribution companies to improve revenue collection, debt prevention and ensure customer satisfaction. In this paper, we investigate changes in bill payments pattern of customers in Dhaka, Bangladesh who had switched from post to pre-payment meters. We collected postpaid bill and prepaid recharge payment data over there years. We specifically look into payment behavior of residential household customers to understand the effect of prepaid meters on payment delinquency. Analysis of postpaid bill indicate that at least 32% households skipped paying one or more bills over a period of one year. Households consuming 100-300 KWH accounts for almost 51% of the total delinquent households. After prepaid switch, approximately 46% of all households are making prepayments every month. 52% of households who skip paying bill and 45% of households who pay bill after due date, at least once, are now recharging every month. Overall the technological intervention shows considerable reduction of retail debts and a behavioral shift towards on time payment.
Land Use / Land Cover
Deep-learning coupled with novel categorization method to classify the urban environment of the developing world
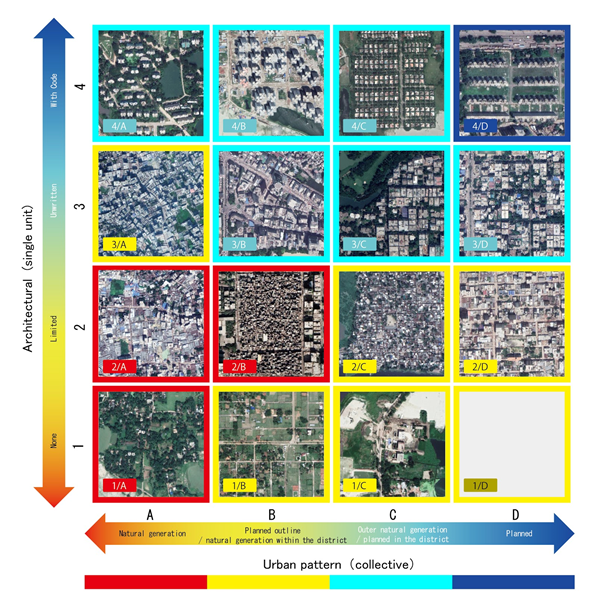
With advent of high definition satellite images, high resolution data, novel computational methods such as deep neural network analysis, and hardware capable of high-speed analysis- urban planning is seeing a paradigm shift. Legacy data on urban environments are now being complemented with high-volume, high-frequency data. However, the first step of understanding urban space lies in useful categorization of the space that is usable for data collection, analysis and visualization. In this paper we propose a novel categorization method that is readily usable for machine analysis and show applicability of the methodology on a developing world setting.
Categorization to plan sustainable urban spaces should encompass the buildings and their surroundings. However, the state-of-the-art is mostly dominated by classification of building structures, building types etc and largely represents the developed world. Hence, these methods and models are not sufficient for developing countries such as Bangladesh where the surrounding environment is crucial for the categorization. Moreover, these categorizations propose small-scale classifications, which give limited information, have poor scalability, and are slow to compute in real time.
Our proposed method is divided into two steps-categorization and automation. We categorize the urban area in terms of informal and formal spaces and take the surrounding environment into account. 50km × 50km Google Earth image of Dhaka, Bangladesh was visually annotated and categorized by an expert and consequently a map was drawn. The categorization is based broadly on two dimensions-the state of urbanization and the architectural form of urban environment. Consequently, the urban space is divided into four categories: a) highly informal area; 2) moderately informal area; 3) moderately formal area; and 4) highly formal area. In total sixteen sub-categories were identified.
For semantic segmentation and automatic categorization, Google’s deep labV3 plus model was used. The model uses Atrous convolution operation to analyze different layers of texture and shape. This allows us to enlarge the field of view of the filters to incorporate larger context. Image encompassing 70% of the urban space was used to train the model and the remaining 30% was used for testing and validation. The model is able to segment with 75% accuracy and 0.60 Mean Intersection over Union (mIoU)
Qianwei Cheng, A K M M Rahman, Anis Sarker, Abu Bakar Siddik Nayem, Ovi Paul, Amin Ahsan Ali, Ryosuke Shibasaki, Moinul Zaber, “Deep-Learning Coupled with Novel Categorization Method to Classify the Urban Environment of the Developing World” has been accepted for “, ICRSETE 2020: International Conference on Remote Sensing, Environment and Transportation Engineering, Paris, France, 2020
Rahman AKMM, Zaber M, Cheng Q, Nayem ABS, Sarker A, Paul O, Shibasaki R. Applying State-of-the-Art Deep-Learning Methods to Classify Urban Cities of the Developing World. Sensors. 2021; 21(22):7469. https://doi.org/10.3390/s21227469
Cheng Q, Zaber M, Rahman AM, Zhang H, Guo Z, Okabe A, Shibasaki R. Understanding the Urban Environment from Satellite Images with New Classification Method—Focusing on Formality and Informality. Sustainability. 2022; 14(7):4336. https://doi.org/10.3390/su14074336
ICT For Education
The Inclusion of ICT Tools in Education: What works, what doesn’t and why do they work?
A Visualization of how usage of ICT Tools by school headmasters is influenced by the attitude towards inclusion and their access to technology. Each bubble represents the “scores” obtained by a school headmaster in terms of his/her access to ICT tools and training, his “Attitude” (i.e. opinion and confidence) towards using ICT tools inside and outside classrooms, and the level (i.e. frequency and intensity) of usage of ICT tools in teaching learning and administrative purposes. The size of the bubbles represent the comparative usage score of the headmasters. The bigger the bubble, the more their usage.
- We aim to analyze the current state of ICT Inclusion in the schools of Bangladesh.
- Using the responses to a survey conducted on 33 Headmasters, 46 school teachers, 56 students and 32 ICT Coordinators from around 30 schools in Bangladesh, we aim to identify the obstacles that hinder the widespread use of ICT tools in teaching learning and school management purposes.
- Based on the survey responses, and data about the schools from various external sources, we cluster the surveyed schools based on various parameters including the academic performance of the school’s students in public examinations, teacher-student ratio, availability of ICT tools and resources in the school, duration of usage of those tools in teaching-learning,
the level of urbanization of the community surrounding the school, average family income of the community, etc. - Based on their responses, we assign a score to the level of access, attitude and usage of ICT facilities for each headmaster, teacher and student who responded.
- As part of our ongoing research, we are working on devising strategies to make sense of the available data, and find out which underlying factors influence the usage of ICT tools in education in the schools of Bangladesh.
Monitoring Air Pollution
Visualization of PM2.5 time series and correlation analysis of cities in Bangladesh
This study is conducted in several cities in Bangladesh toward understanding the characteristics of PM 2.5 such as spatial-temporal characterization, correlation of other particulate matter such as human activities, driving factors and environmental casualties. Significant time-lagged correlations were discovered between the PM 2.5 time series in different city groups throughout the country using the visualization framework. The Heatmaps show that the pooled series correlations are less significant in summer and between cities of greater distance as well as there are seasonal changes in the time lag magnitude and direction of the best shifted correlated particulate matter time series. The geomap visualization demonstrates interactions of air pollution among districts around Dhaka city and the significant effect of wind direction on correlated shifted time series. Clustering on the data gave an insight on the time and zone groups. The visualization framework could help determine the pathway of regional transportation of air pollution and may also be useful in delineating the area of interaction of PM 2.5 pollution for impact analysis.
Cross Correlation Analysis: Determining whether any district has any influence over other districts and selecting the time-lag with maximum correlation
A. Zaman, S. B. Rabbani, R. Ridwanul Haque and M. Zaber, “Seasonal, Temporal and Spatial Variation of Particulate Matter Concentration in Bangladesh: A Longitudinal Analysis,” 2021 IEEE Region 10 Symposium (TENSYMP), 2021, pp. 1-8, doi: 10.1109/TENSYMP52854.2021.9550877.
Inland Water Port Connectivity
A Complex Network Analysis of Inland Water Port of Bangladesh
A well-structured inland waterways system should help Bangladesh fulfill SDG goals. In this study, we employ complex network analysis methods to analyze the river-port network of the country. We ascertain different types of ports based on their importance and placement in the connectivity network. Data regarding port location, vessel routes, and schedules were collected from governmental resources. Using the data, a connectivity network was built for further analysis. Different measures of network analysis are used to categorize the ports and the network model has been identified. These categories should help transportation planners and policymakers to better design the inland waterways network of Bangladesh.
Publication:
F. Tabassum, H. Islam, A. A. Ali and M. Zaber, “A Complex Network Analysis of Inland Waterways Port Connectivity of Bangladesh” in IEEE Region 10 Symposium (TENSYMP), Dhaka, 2020.
Nightlights For Economic Condition
What can Nighttime Lights tell us about Bangladesh?
Analyzing the state and growth of various socio-economic indicators is essential for effective developmental planning at a sub-national level. However, in many cases, data regarding such indicators are not publicly available and/or hard to collect. In many other cases, the available data may not be recent enough. In contrast, satellite data is both readily available and up-to-date. In recent times, various studies have been conducted to use different types of satellite data as a proxy to determine the condition of socio-economic indicators in different places around the world. In this paper, we study the efficacy of one such data source, nighttime lights (NTL), for monitoring factors related to sustainable development in the context of Bangladesh.
Publications:
M. Wahed, R. A. Rizvee, R. R. Haque, A. M. Ali, M. Zaber and A. A. Ali, “What Can Nighttime Lights Tell Us about Bangladesh?” in IEEE Region 10 Symposium (TENSYMP), Dhaka, 2020.